In the first part of blog series, we configured Radiator to export data in JSON format. This part shows some basic examples about utilising that data.
The setup introduced in blog series part 1 is running and it produces log data in JSON format. The JSON data is forwarded to an analysis tool. In this case, we use Elastic Stack and its visualisation tool Kibana for analysing the sample data. For more information about Elastic Stack, see the Elastic Stack website, or an open source fork of Elastic Stack, OpenSearch. Configuring the data forwarding depends on the chosen tool and it is not discussed in this blog post.
This image shows how the log data is processed when using Elastic Stack for analysing:

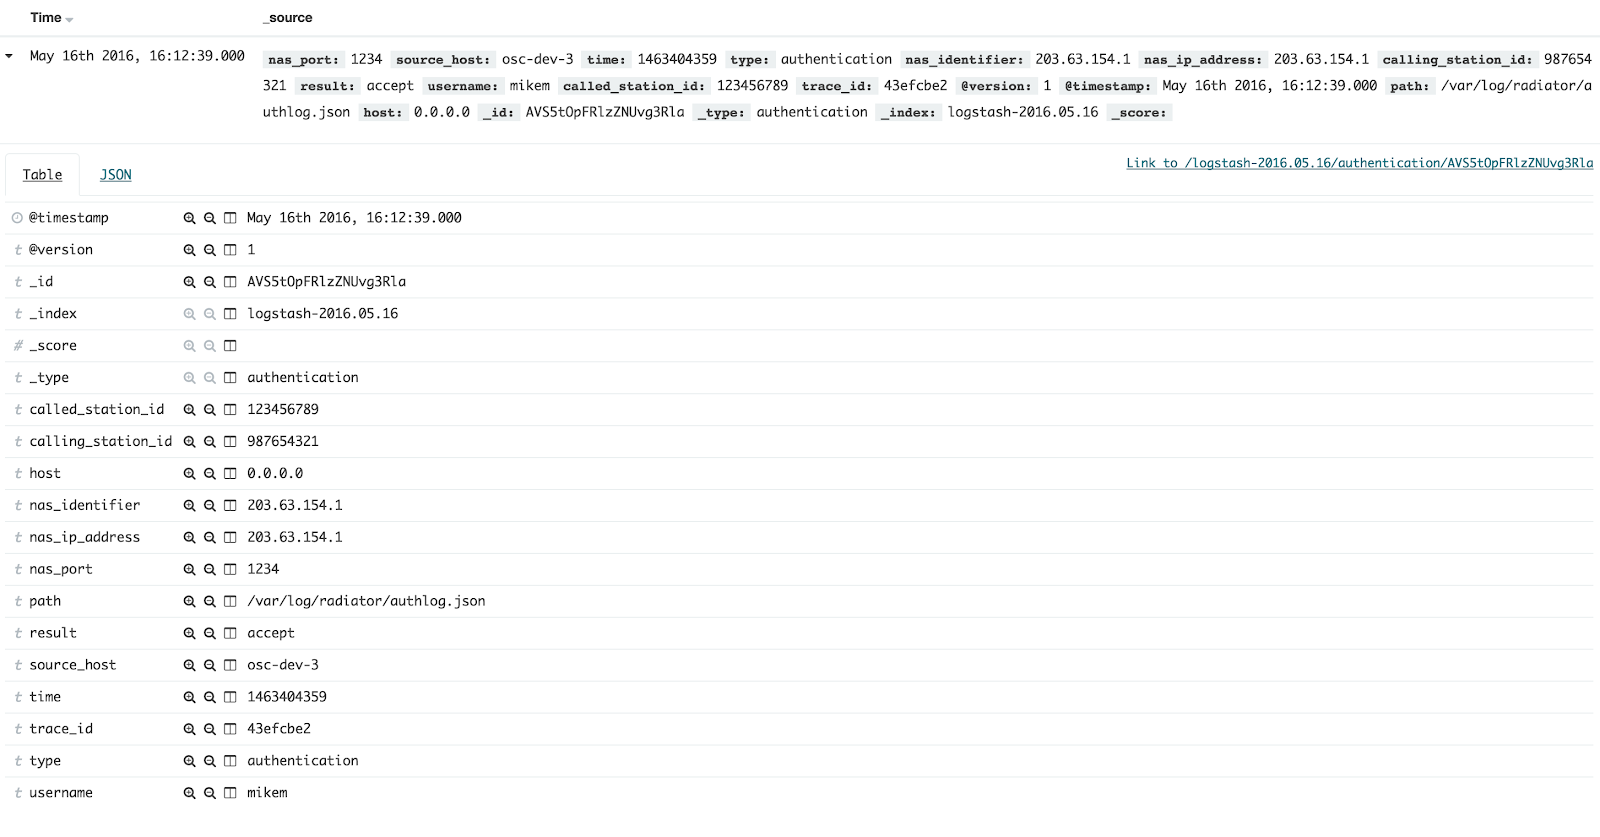
radpwtst tool, which is included in Radiator distribution, is used as a RADIUS client. Thus, it authenticates via RADIUS and Radiator logs authentication attempts as entries to authlog.json file. Here is a sample of one authentication entry as shown in the JSON file:
{"nas_port":"1234","source_host":"osc-dev-3","time":"1463404359","type":"authentication","timestamp":"2016-05-16T16:12:39Z","nas_identifier":"203.63.154.1","nas_ip_address":"203.63.154.1","calling_station_id":"987654321","result":"accept","username":"mikem","called_station_id":"123456789","trace_id":"43efcbe2"}
The name-value pairs are not ordered in any way so they are hard to read as such. To get a better idea of the data, it must be parsed. One option is to use
Visualising log data with Kibana
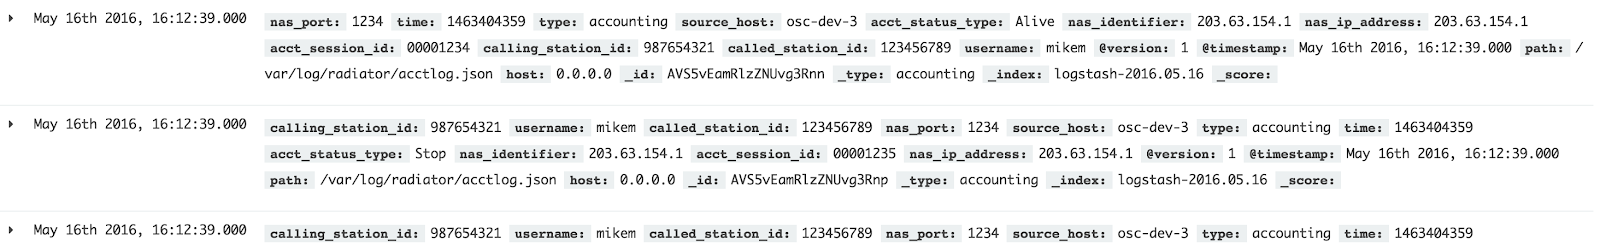
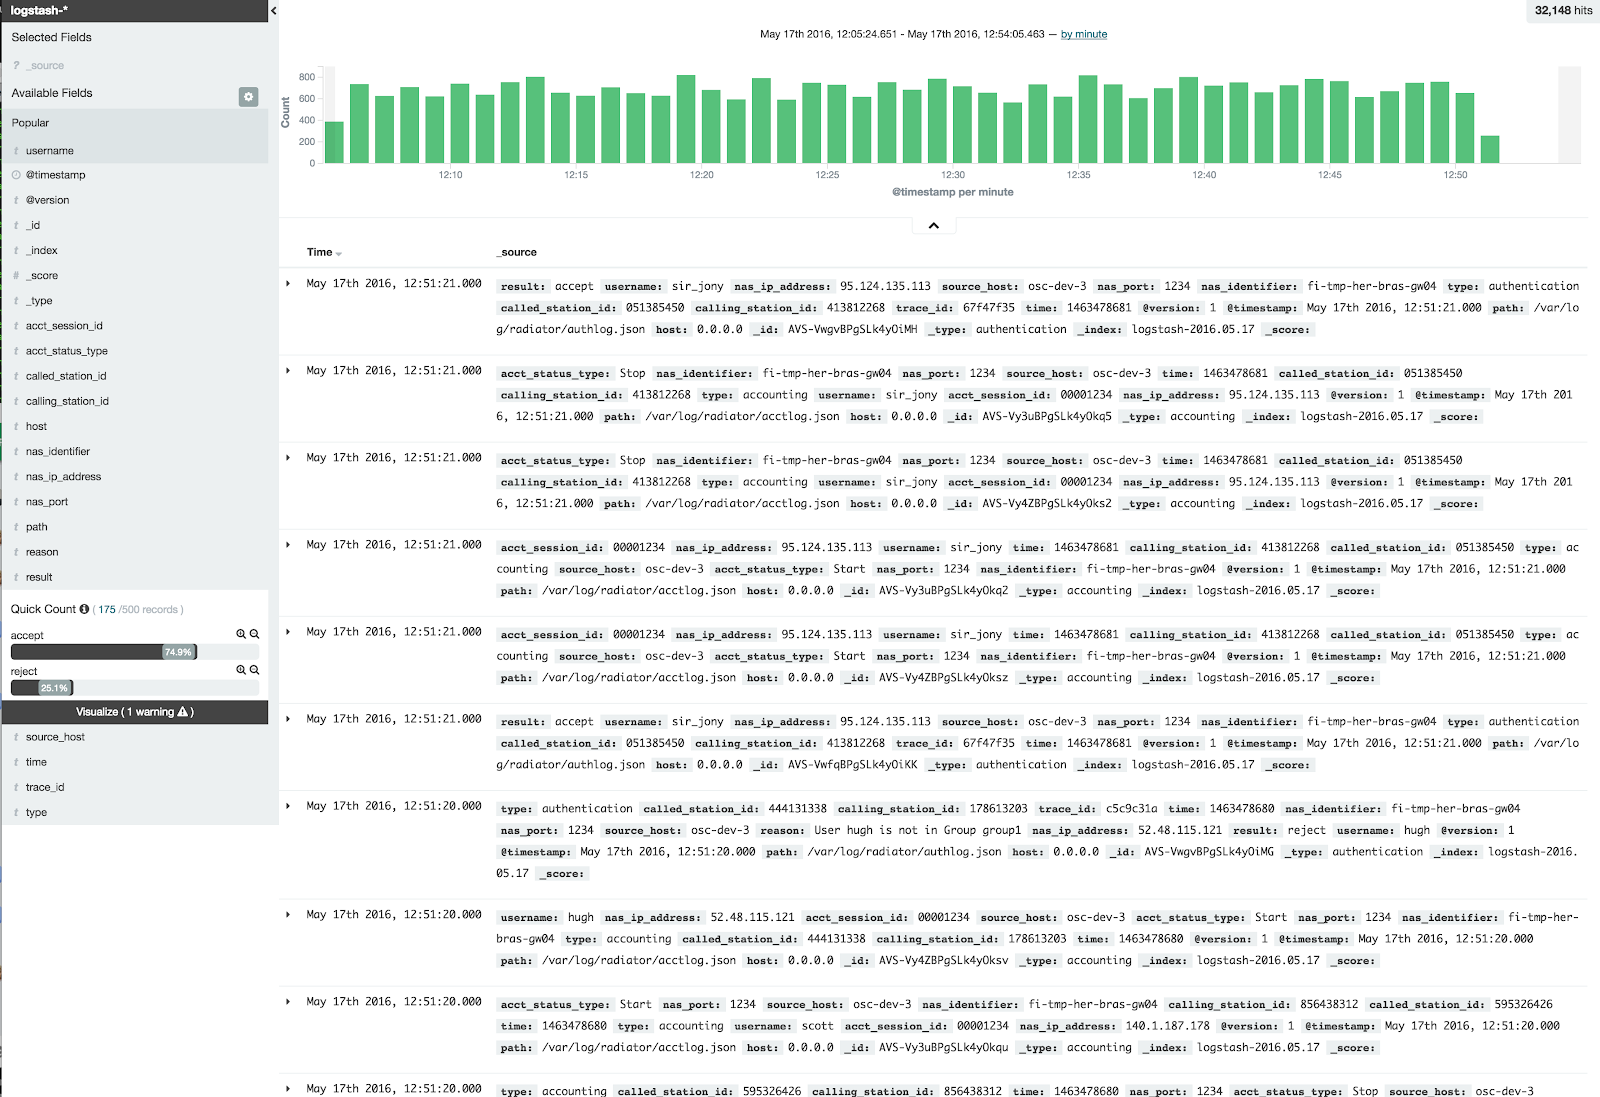
By clicking each entry open, we can verify that all name-value pairs are distinguished. By default, each name-value pair is indexed and searchable, and if you add new fields to the JSON data, Elastic Stack indexes them automatically. They are parsed and usable in your searches without need for other modifications. This enables searching of wide variety of name-value pairs and their combinations.
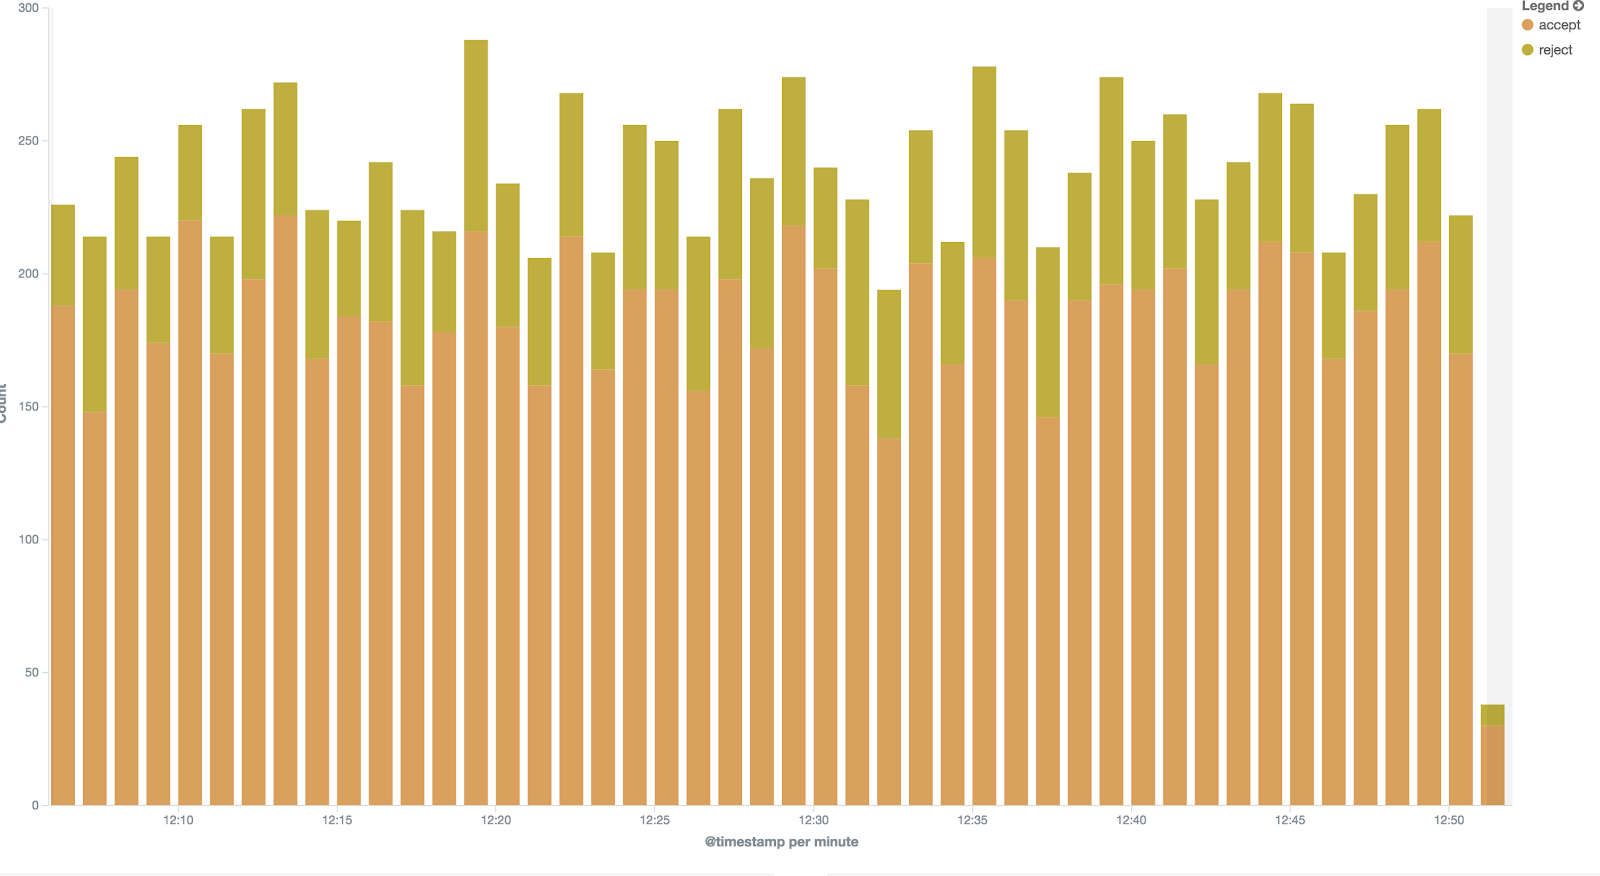
Kibana shows the amount of entries in each time window. By filtering everything else but authentication-related entries, we see trends in amount of authentication attempts.
Similarly, we can create visualisation of access/reject rate within a certain time frame.